Analysis of mitochondrial and plasma membrane potentials
- Motivation and scope: A brief description
- Modelling: The physiological model and its mathematical formulation
- Potential models overview: Information of the various model variants
- Technical Implementation of the Simulation Tool
Motivation and Scope
The characterization of cellular physiology and the cellular bioenergetics through multi-parameter analysis is critical to our understanding of the pathophysiology of disease progression and the mechanisms of drug actions at a cellular level. The mitochondrial membrane potential (ΔΨm) is a key indicator of mitochondrial function and the characterization of ΔΨm in situ allows for an accurate determination of mitochondrial bioenergetics and cellular metabolism. To access information on changes in ΔΨm in situ, monovalent cationic fluorescent dyes such as tetramethylrhodamine methyl ester (TMRM) are widely used due to their non-invasive nature. As TMRM is a Nernstian probe in nature, mathematical analysis can provide quantitative output for both ΔΨm and ΔΨp over time (Ward et al. 2000, Dussmann et al. 2003, Nicholls 2006, Ward et al. 2007). Here, we have utilized the single cell characterization of ΔΨm to develop an automated computational model implemented into MATLAB (The Mathworks, UK) that interprets the single cell fluorescence for TMRM as a consequence of changes in either ΔΨm or ΔΨp. Parameter fitting was implemented using the in-built Newton based root-finding algorithm FMINSEARCH of MATLAB, allowing for up to 50,000 iterations thereby removing the manual fitting of parameters, and allowing for the rapid extraction of meaningful, statistical cause-and-effect relationships from large data sets. In addition to this, this web service provides models for data analysis and a valuable repository for experimental data collection which can be utilized in both academic research, and high throughput screening platforms within industry.
As an introduction we will consider the variability in the TMRM responses obtained from populations of primary neurons following glutamate receptor overactivation (Ward et al. 2007) in doing so you can begin to appreciate the versatility of the Web Service in providing predictive output on changes in ΔΨm and ΔΨp.
Through experimentation we have defined models of stimulus induced tolerance, apoptosis and necrosis (mono and biphasic). As a biological example, we will consider the physiological effects of the neurotransmitter Glutamate and its antagonist MK801 further.
- Tolerance model: Transient (5 min) glutamate (100 µM) excitation with no evidence of neuronal injury during a 24 h period. Cells characteristically have a significantly increased TMRM fluorescence following the excitation phase that is maintained for 24 h and is representative of a sustained hyperpolarization of ΔΨm.
- Apoptotic model: Transient (5 min) glutamate (100 µM) excitation resulting in apoptotic cellular injury. Cells characteristically have a significantly increased TMRM fluorescence following the excitation phase, however, there is a rapid decay in both ΔΨm and ΔΨp hours after the initial excitation. This injury itself can be seen experimentally by sharp decrease of TMRM fluorescence that is induced by a rapid decay of both potentials.
- Monophasic Necrotic Model: Prolonged glutamate (100 µM) excitation resulting in the rapid loss of TMRM fluorescence. The monophasic model describes a single phase decrease of both ΔΨm and ΔΨp.
- Biphasic Necrotic Model: Prolonged glutamate (100 µM) excitation resulting in a secondary delayed (15 min – 4 h) loss of TMRM fluorescence with the biphasic decay of ΔΨm and ΔΨp due to two different phases of potential depolarization.
Modelling
The mitochondrial membrane potential (ΔΨm) is the central parameter controlling the accumulation of Ca2+ within the mitochondrial matrix as well as respiration and ATP synthesis. A careful characterization of the ΔΨm in situ allows for an accurate determination of mitochondrial bioeneregetics and function. The fluorescent membrane-permeant cationic probe TMRM has become one of the more readily used probes in the analysis of ΔΨm in intact cells. The ability to measure ΔΨm paralleled to cellular and mitochondrial physiology, protein localization and real time enzymatic kinetics enables us to characterize the progression of necrotic and apoptotic cell death as well as cell survival following the addition of stimuli and drugs.
The mathematical model used is an extension of the model proposed by Ward et al. (Ward et al. 2000) for the analysis of the fluorescence response of mono-valent cationic probes as depicted in Fig.1.

Nernstian equilibration of a generic membrane-permeant monovalent cation c+ among the extracellular, cytoplasmic, and mitochondrial matrix phases at 37°C results in the following relationships for the concentrations of the free cations at equilibrium:

where ΔΨp and ΔΨm are the plasma and mitochondrial membrane potentials, and the divisor 61.5 is the value (in mV) for 2.3 RT/ F at 37°C with 2.3 being the conversion factor to decadic exponents. Re-equilibration of the cytosolic and extracellular compartment due to changes in the potentials ΔΨp and ΔΨm are taken into account by assuming a first order flux between the extracellular medium and the cytosol
![]()
where c is a constant proportional to the permeability of the probe across the plasma membrane. The equilibration effects between the mitochondria and the cytosol are assumed as immediate. From this, we obtain the whole-cell fluorescence f [cell] as the sum of the cytoplasmic and matrix signals by taking into consideration the distinct behaviour due to quenching of the fluorescence signal within the mitochondria with the quench threshold concentration c

Here, is the quantum yield of the probe and and are denoting the cytosolic and total mitochondrial volume.
Based on this simple model, we provided a straightforward extension using a MATLAB (The Mathworks, UK) based script to apply the method to cell population studies. This has been achieved by implementing a Newton routine for fitting the membrane potentials to the experimental fluorescent traces, which identifies an optimal fit without the restriction of bias due to manual parameter variation.
Potential models overview
To guarantee an optimal trade-off between versatility of the fitting routine and the biological situation and to assure a convergence of the fitting routine, we assume a given functional behaviour for the time course of both potentials as present and optimize only the shape parameter of these functions. Within this section, we give a brief description of the different functional models by means of a graphical representation and by tables describing the used parameters. For information about the underlying biology, please refer to Ward, Huber et al, 2007.
General information and common parameters
To assure convergence of the fitting method, appropriate starting values for the parameters have to be chosen. Based on prior analyses, each of the potential models used here, provides such default values that may be modified by the user. These values are then optimized through the routine. However, since such high dimensional fitting routines usually suffer from ambiguities due to local minima (i.e. a parameter sets that optimizes the fitting, but render biologically unrealistic data), we have to restrict the variability of the parameters to a realistic range. As options, various fitting ranges (+/- 10 % variation of the starting value, +/- 100 % variation of this value, free i.e. unlimited variation) ranges can be selected. Again, each model provides proven default values.
Similar to the potential specific fitting parameter and unlike the fixed experimental parameters (time of glutamate excitation, addition of glutamate antagonist, quench threshold), the following common general model parameters may also be fitted.
- V_mito: This parameter represents fraction of the total mitochondrial volume relative to the cytosolic volume. Since v_mito can be only determined experimentally within a certain range and varies (6.2 ± 0.8 %) between different cells, this parameter is also made available for fitting. It is recommended to allow for 10% variations since this reflects the detected variability within cell populations.
- Kinetic constant: This is the relaxation constant as seen in Eq.2 and is due to the delay of movement of the TMRM through the plasma membrane. It is obtained in control experiments where either ΔΨp or ΔΨm are depolarized (high KCl, FCCP, CCCP) and the redistribution constant for TMRM is calculated. A variation of 10% is also recommended for this parameter.
- The other parameters are dependent on the potential model as described below
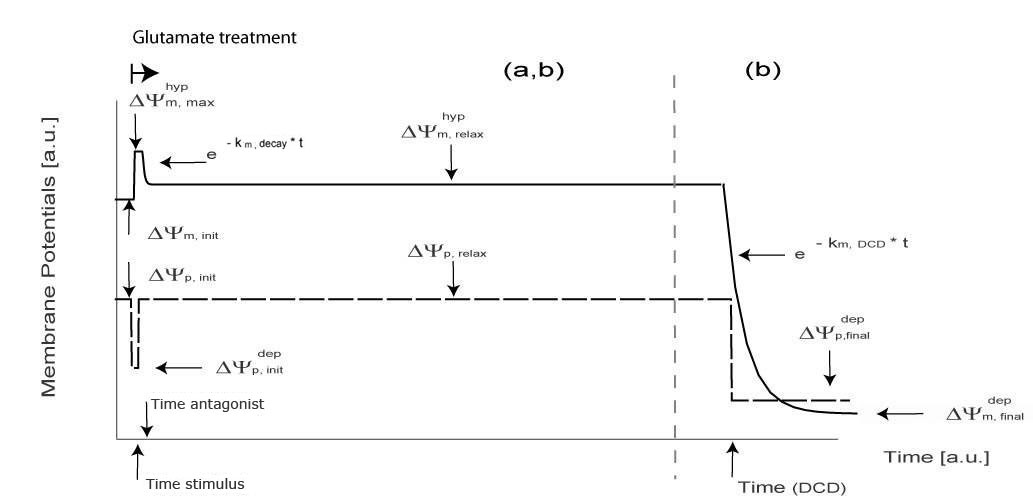
Apoptotic and Tolerance Models in Neurons following transient glutamate excitation
In the majority of neurons (97.1%) a transient depolarization of ΔΨp was associated with glutamate receptor overactivation with values for ΔΨp returning to pre-stimulation levels within a relatively short (5-15 min) period of time post excitation. The values for ΔΨmpost glutamate excitation were found to be significantly higher (p<0.001) than before glutamate excitation in the majority of neurons. Of significant note ΔΨm was found to be the highest in neurons tolerant to transient glutamate excitation.

Tolerance Model -> panel a
| Symbol | Meaning |
| k m, decay | Exponential Decay after Hyperpolarization |
| ΔΨ depp, init | Initial Plasma Membrane Depolarization |
| ΔΨ hypm, max | Initial Mitochondrial Hyperpolarization |
| ΔΨ hypm, relax | Intermediate Mitochondrial Polarization |
| ΔΨp, relax | Intermediate Plasma Membrane Polarization |
Apoptotic Model -> panel b
| Symbol | Meaning |
| k m, decay | Exponential Decay after Hyperpolarization |
| km, DCD | Exponential Decay after DCD (Delayed Calcium Deregulation) |
| tDCD | Time of DCD (Delayed Calcium Deregulation) |
| ΔΨ depp, init | Initial Plasma Membrane Depolarization |
| ΔΨ hypm, max | Initial Mitochondrial Hyperpolarization |
| ΔΨ hypm, relax | Intermediate Mitochondrial Polarization |
| ΔΨp, relax | Intermediate Plasma Membrane Polarization |
| ΔΨ depm, final | Final Mitochondrial Polarization |
| ΔΨ depp, final | Final Plasma Membrane Polarization |
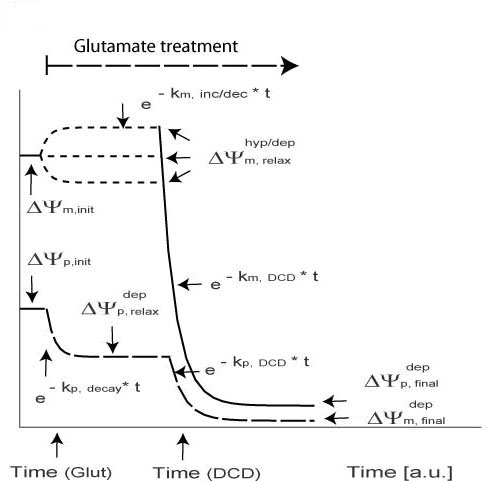
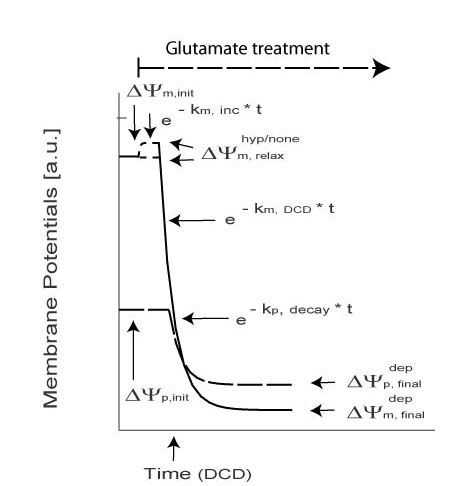
Necrotic Models during continuous glutamate exposure
Continuous glutamate exposure results in necrotic cell injury. This is characterized by a mono or biphasic decay of both ΔΨm and ΔΨp.

Monophasic Necrotic Model
| Symbol | Meaning |
| kp, decay | Exponential Decay after DCD |
| km, DCD | Exponential Decay after DCD (Delayed Calcium Deregulation) |
| tDCD | Time of DCD (Delayed Calcium Deregulation) |
| ΔΨ depp, init | Initial Plasma Membrane Depolarization |
| ΔΨ hyp/nonem, relax | Initial Mitochondrial Hyperpolarization |
| ΔΨ depm, final | Final Mitochondrial Polarization |
| ΔΨ depp, final | Final Plasma Membrane Polarization |

Biphasic Necrotic Model
| Symbol | Meaning |
| km, inc/dec | Exponential Increase of Decay of mitochondrial potential |
| kp, decay | Plasma: Exponential Decay /Depolarization |
| tDCD | Time of DCD (Delayed Calcium Deregulation) |
| ΔΨ depp, relax | Plasma: Intermediate Polarization |
| km, DCD | Mito: DCD (Delayed Calcium Deregulation)exponential decay |
| ΔΨhyp/dep m, relax | Mito: Intermediate Polarization |
| kp, DCD | Plasma: DCD (Delayed Calcium Deregulation) Exponential Decay |
| ΔΨdepp, final | Plasma: Final Depolarisation |
| ΔΨdepm, final | Mito: Final Depolarisation |
Technical implementation
The fitting procedure is performed by a Newton Iteration based on MATLAB’s routine FMINSEARCH. The MATLAB m-file is executed by the MATLAB Web Server which is facilitated by the APACHE 2 server.
References
Dussmann, H., Rehm, M., Kogel, D. and Prehn, J. H. (2003) Outer mitochondrial membrane permeabilization during apoptosis triggers caspase-independent mitochondrial and caspase-dependent plasma membrane potential depolarization: a single-cell analysis. J Cell Sci, 116, 525-536.
Nicholls, D. G. (2006) Simultaneous monitoring of ionophore- and inhibitor-mediated plasma and mitochondrial membrane potential changes in cultured neurons. J Biol Chem, 281, 14864-14874.
Ward, M. W., Huber, H. J., Weisova, P., Dussmann, H., Nicholls, D. G. and Prehn, J. H. (2007) Mitochondrial and plasma membrane potential of cultured cerebellar neurons during glutamate-induced necrosis, apoptosis, and tolerance. J Neurosci, 27, 8238-8249.
Ward, M. W., Rego, A. C., Frenguelli, B. G. and Nicholls, D. G. (2000) Mitochondrial membrane potential and glutamate excitotoxicity in cultured cerebellar granule cells. J Neurosci, 20, 7208-7219.
Acknowledgements
This research was supported by grants from Science Foundation Ireland to JHMP (03/RP1/B344S), the Irish Health Research Board (HRB RP 181/2006) to M.W.W. and by Siemens Research Ireland.